Giving a shape to communities that drift, split, and merge through time.
Networks of people, machines, or topics are rarely static. A research group gains members, a cluster of servers shifts its workload, a conversation fragments into sub-threads. TimeRadar is a visual answer to a deceptively simple question: how does the structure of a community change from one moment to the next?
The idea
Conventional node–link diagrams show who is connected to whom, but they collapse under the weight of time — a separate graph per day quickly becomes an unreadable flipbook. TimeRadar instead lays time out along concentric rings and partitions each ring into wedges, one per community. The eye follows a wedge inward-to-outward to read its whole life story.
What it reveals
- →Growth and decline — wedges that widen or narrow over successive rings.
- →Splits and merges — the moments a single community fractures or two fold into one.
- →Stable cores — wedges that hold their shape while everything around them churns.
A good timeline view should let you ask “what changed?” and answer it without scrubbing back and forth.
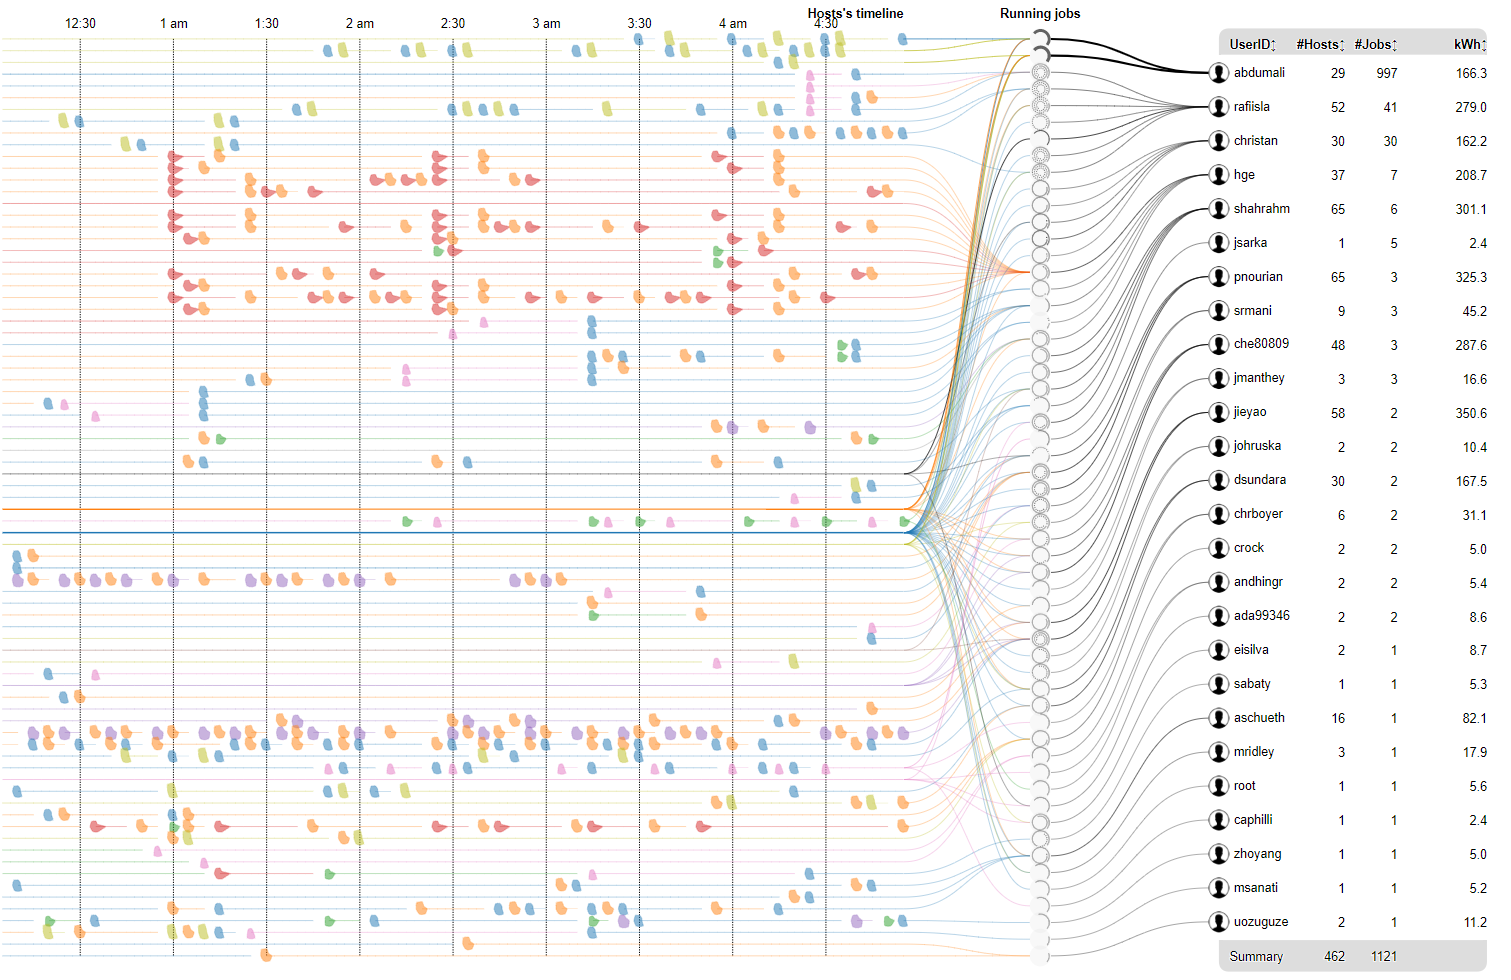
Presented at IEEE COMPSAC 2021, TimeRadar was built in the iData Visualization Lab at Texas Tech as part of the HiperView monitoring suite for the university’s High Performance Computing Center — the same D3-based toolkit that produced JobNet, JobViewer, and HiperVR.