What if monitoring a data center felt less like reading a dashboard and more like walking the floor?
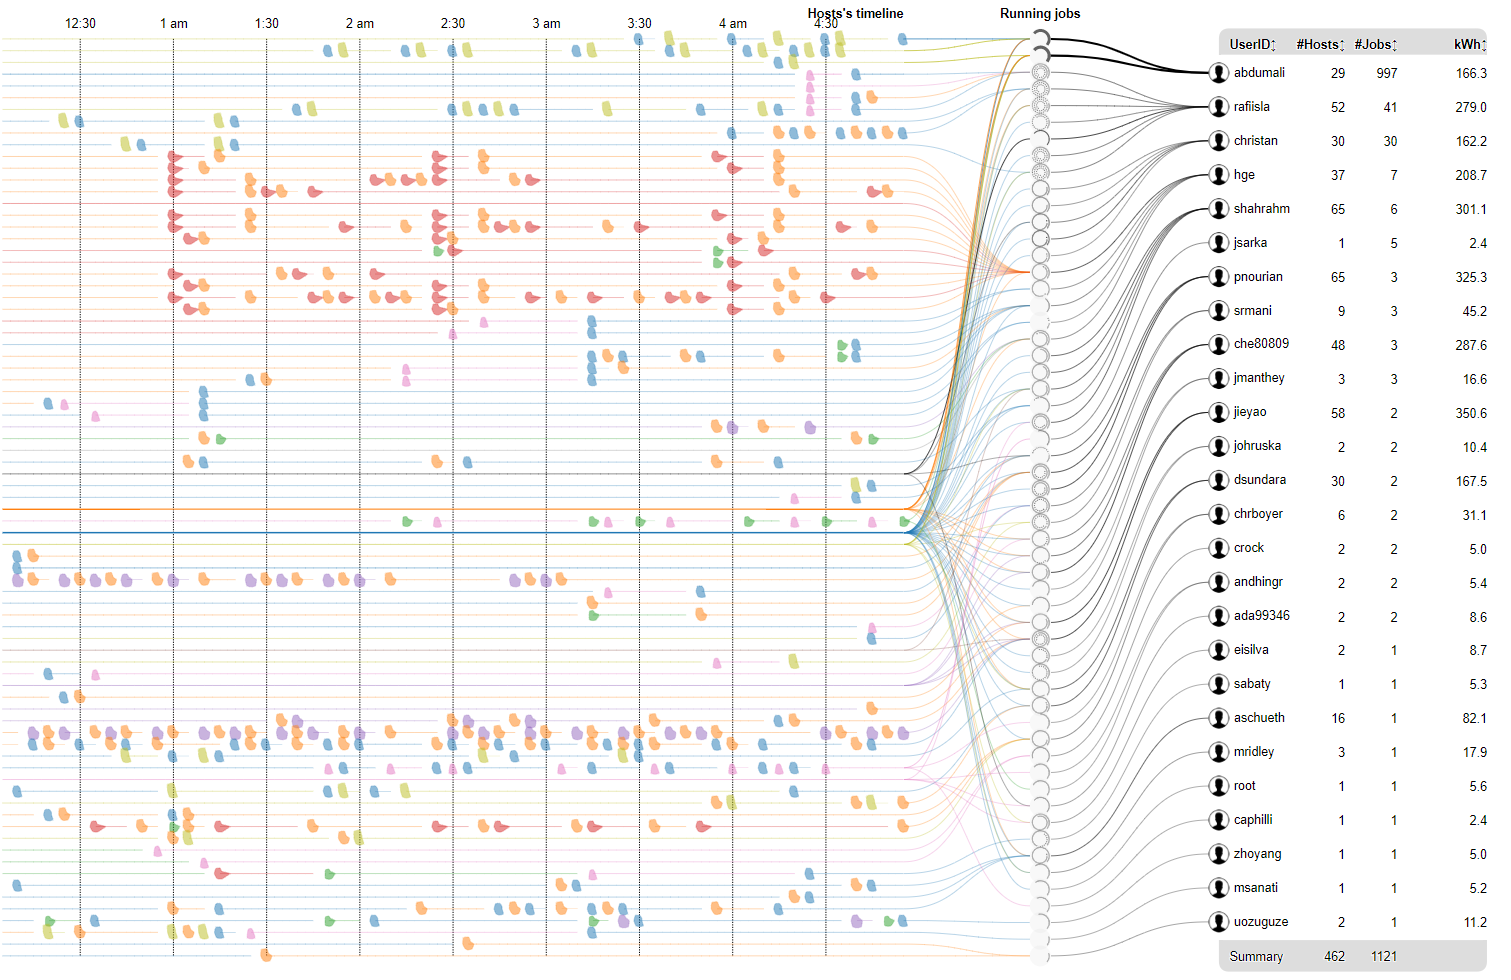
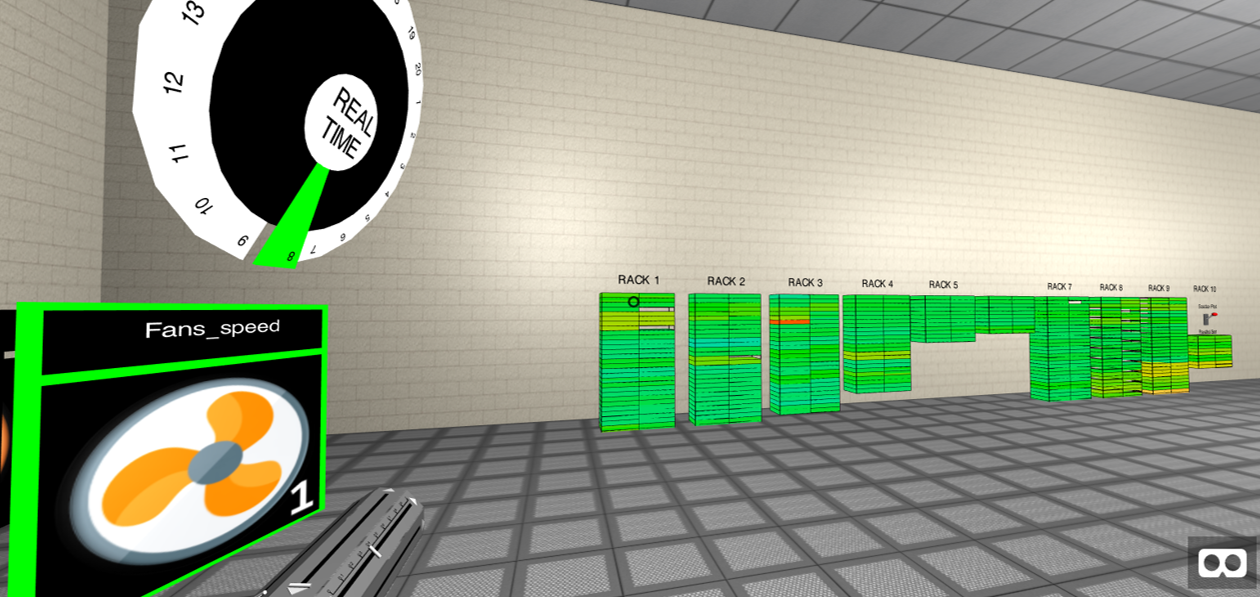
System health is high-dimensional: temperature, load, memory, power, fan speed — dozens of signals per node, thousands of nodes. HiperVR takes that firehose and places it in a virtual room you can step inside, trading flat dashboards for an embodied sense of where the trouble is.
Why VR, and not just another chart
Humans are extraordinarily good at spatial memory — we remember where things are. HiperVR leans on that: instead of scanning a grid of sparklines, an operator builds a mental map of the machine and notices when a familiar region lights up. Depth and motion add channels that a 2D screen simply does not have.
Immersion is not a gimmick when the data is genuinely spatial — a data center is, after all, a room.
Published at ACM PEARC 2019 and built in the iData Visualization Lab at Texas Tech, HiperVR was one of the first VR explorations in the HiperView/HPCC suite, and a direct precursor to the VR data work in VRParaSet.